

Experience score
A score built from what happened on the device.
The method is fixed before the first fix runs and every change to it is versioned. When the score moves, you and your finance team can check why.
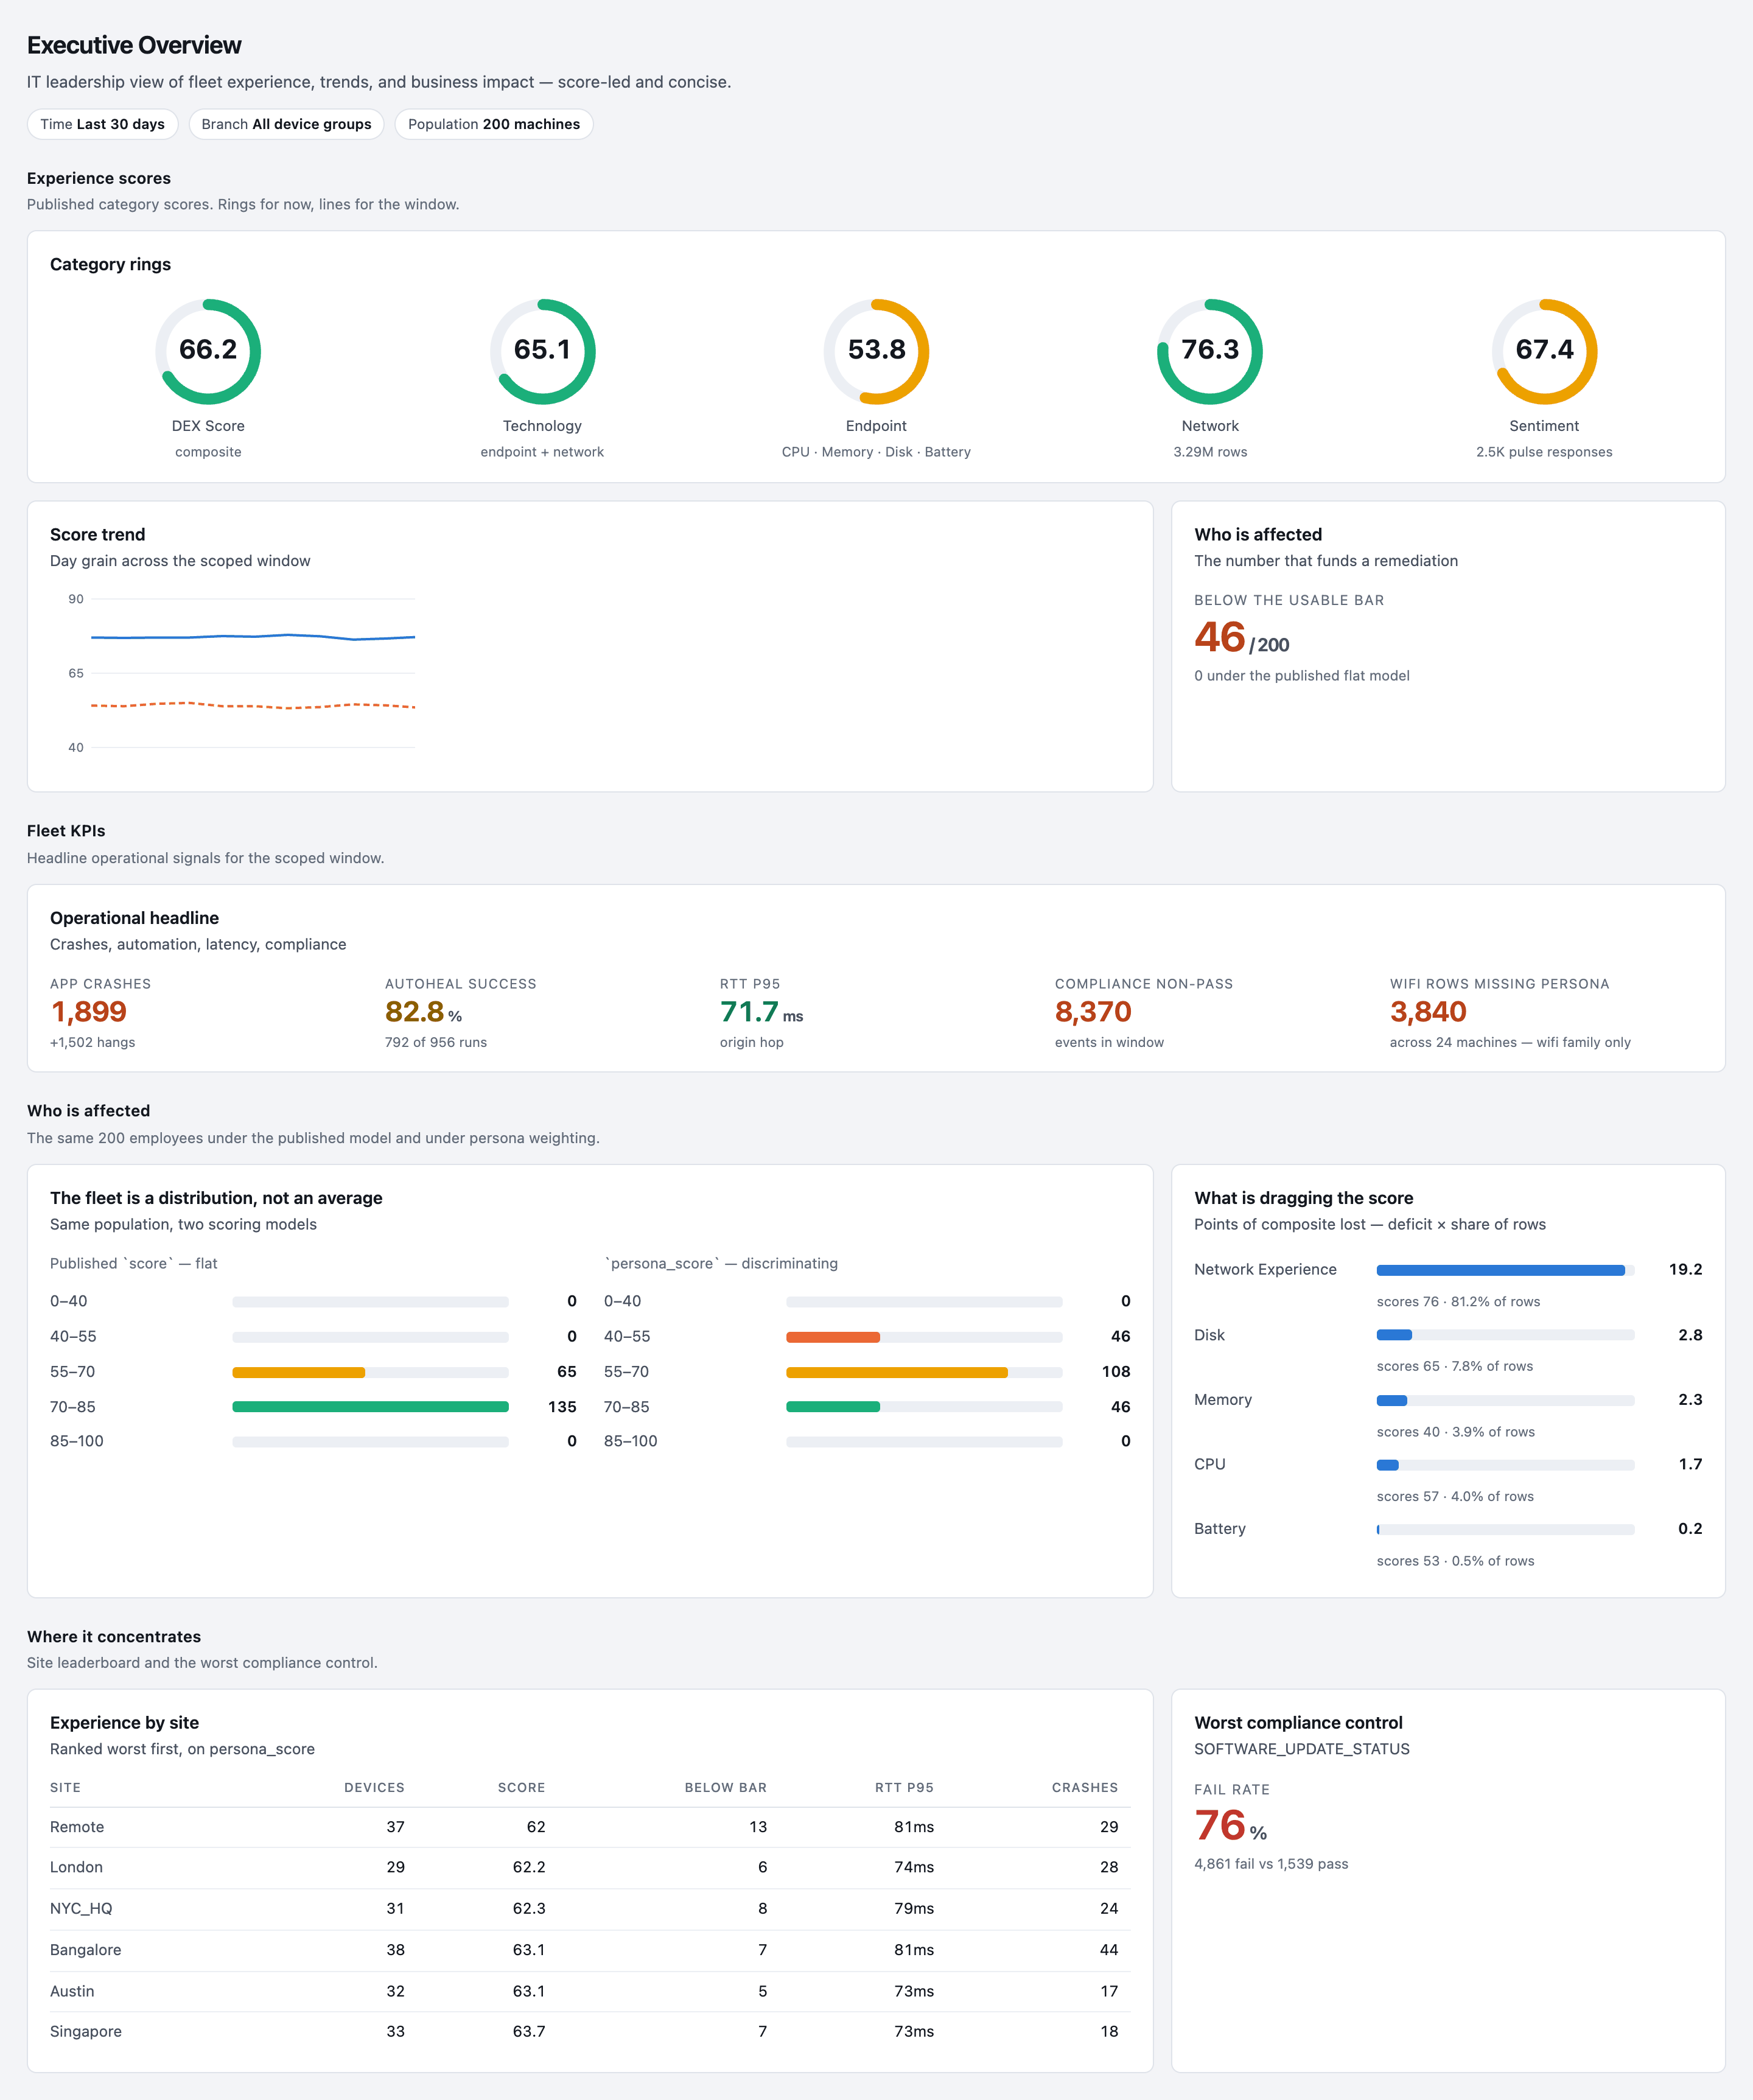
66.2DEX score
- 65.1Technologyendpoint + network
- 53.8EndpointCPU · memory · disk · battery
- 76.3Network3.29M samples
- 67.4Sentiment2.5K pulse responses
When the score moves, you can see why.
How a score moves
The devices changed, or the definition did.
A Wi-Fi fix rolls out and round-trip times fall. Or someone decides a slower round trip is good enough. Both move the line, and only one means the people on those laptops are better off.
What Nanoheal does
A fixed, patented methodology.
The methodology behind Nanoheal’s experience score is patented, US 9,477,573, and fixed independently of the release that reports it. The scoring profile is versioned, so an edit to the definition is on the record. In the example below, v4 moves Wi-Fi latency from the office target to the branch target: the score moves, and you can see it was the definition, not the network.
The experience the employee actually had.
Built from what happened on the device while someone was trying to work, not from the health of a server room. One figure a non-technical reader can act on.
- What’s in it
- The score blends technology measurements and employee sentiment, on a 0–100 scale, so what people feel counts next to what the device reports.
- Bands
- Each score reads good, average or frustrating, against the targets in its profile.
- Metrics
- Technology starts from a default set of metrics across device, application and network health, each with ranges you can review and adjust.
- Sentiment
- Pulse-survey sentiment, with micro-surveys after an update or an Autoheal run, so what people reported sits next to what the device recorded.
- Profiles
- It is a configurable experience score, so a developer laptop and a kiosk aren’t held to the same standard.
Some default ranges are starting points rather than published industry targets, which is why every range is editable.
Metric families, dashboards and how Haya, Nanoheal’s AI and analytics, reads the score are on DEX Intelligence.
A number that moved, and what moved it.
The agent that measures the score runs the fix, so the before and the after sit on one record.
- Per fix
Which fix did it.
You see the experience score before and after each fix, for the group it was published to, so a gain traces to a fix and a date, not to a quarter.
- Per group
Who felt it.
Cut by device group, business unit and department, and by persona, so a gain on the sales floor is not averaged away by the warehouse.
- Per client
Whose it is.
Service providers get an experience score for each client, before and after: the measure an experience-level agreement (XLA) is written against.
What a gain is worth. A 10-point gain has a modelled value in productivity and service-desk cost; the model and its assumptions are on Outcomes and business case. Most of that value is employee time: in HappySignals’ benchmark, 13% of tickets cause 80% of lost productivity.
What you can do with the score.
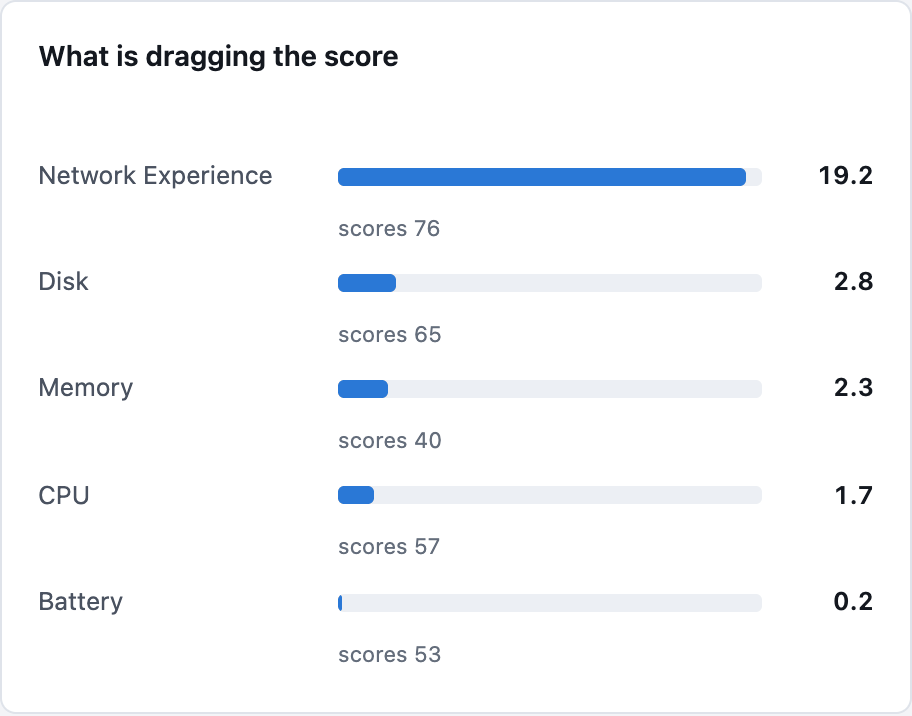
What is dragging the score
Manage & evolve
The score feeds the Manage & evolve stage. It shows which remaining gap would move it furthest, and whether the last fix earned its place.
Manage & evolve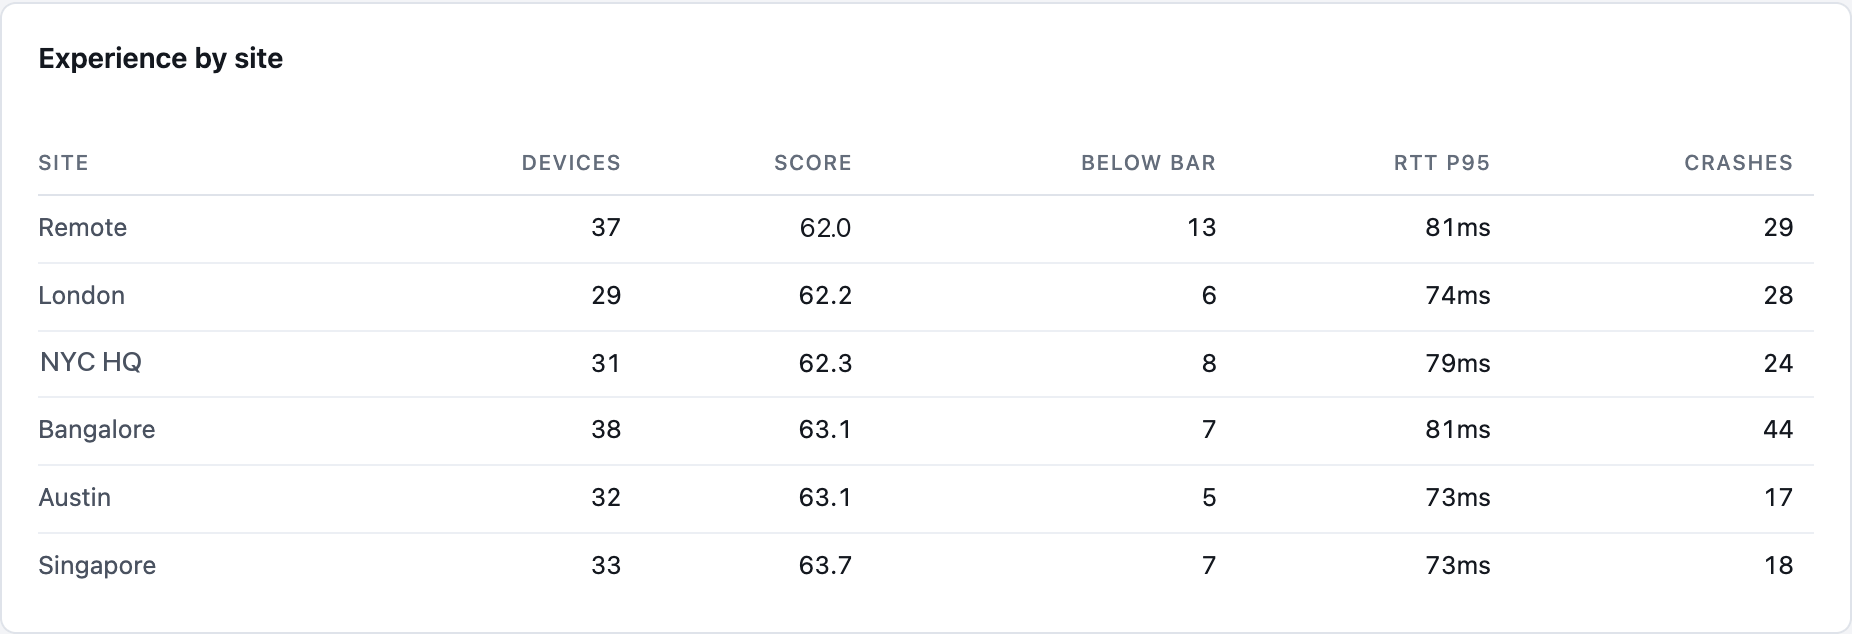
Experience by site
| Site | Devices | Score |
|---|---|---|
| Remote | 37 | 62.0 |
| London | 29 | 62.2 |
| NYC HQ | 31 | 62.3 |
| Bangalore | 38 | 63.1 |
| Austin | 32 | 63.1 |
| Singapore | 33 | 63.7 |
For service providers
A managed workplace service with a repeatable measure can be priced on the outcome rather than on headcount. For service providers, that means an agreement written against a number both sides can check.
Service providersAgree the profile version up front, and both sides know what the number means.